
How a flood early warning system works: observation, forecasting, decision and response
A flood warning is a chain of five links. Each has its own engineering, its own failure modes and its own share of the time you have. Here is how the chain fits together, with a worked routing example and the numbers that measure whether it works.
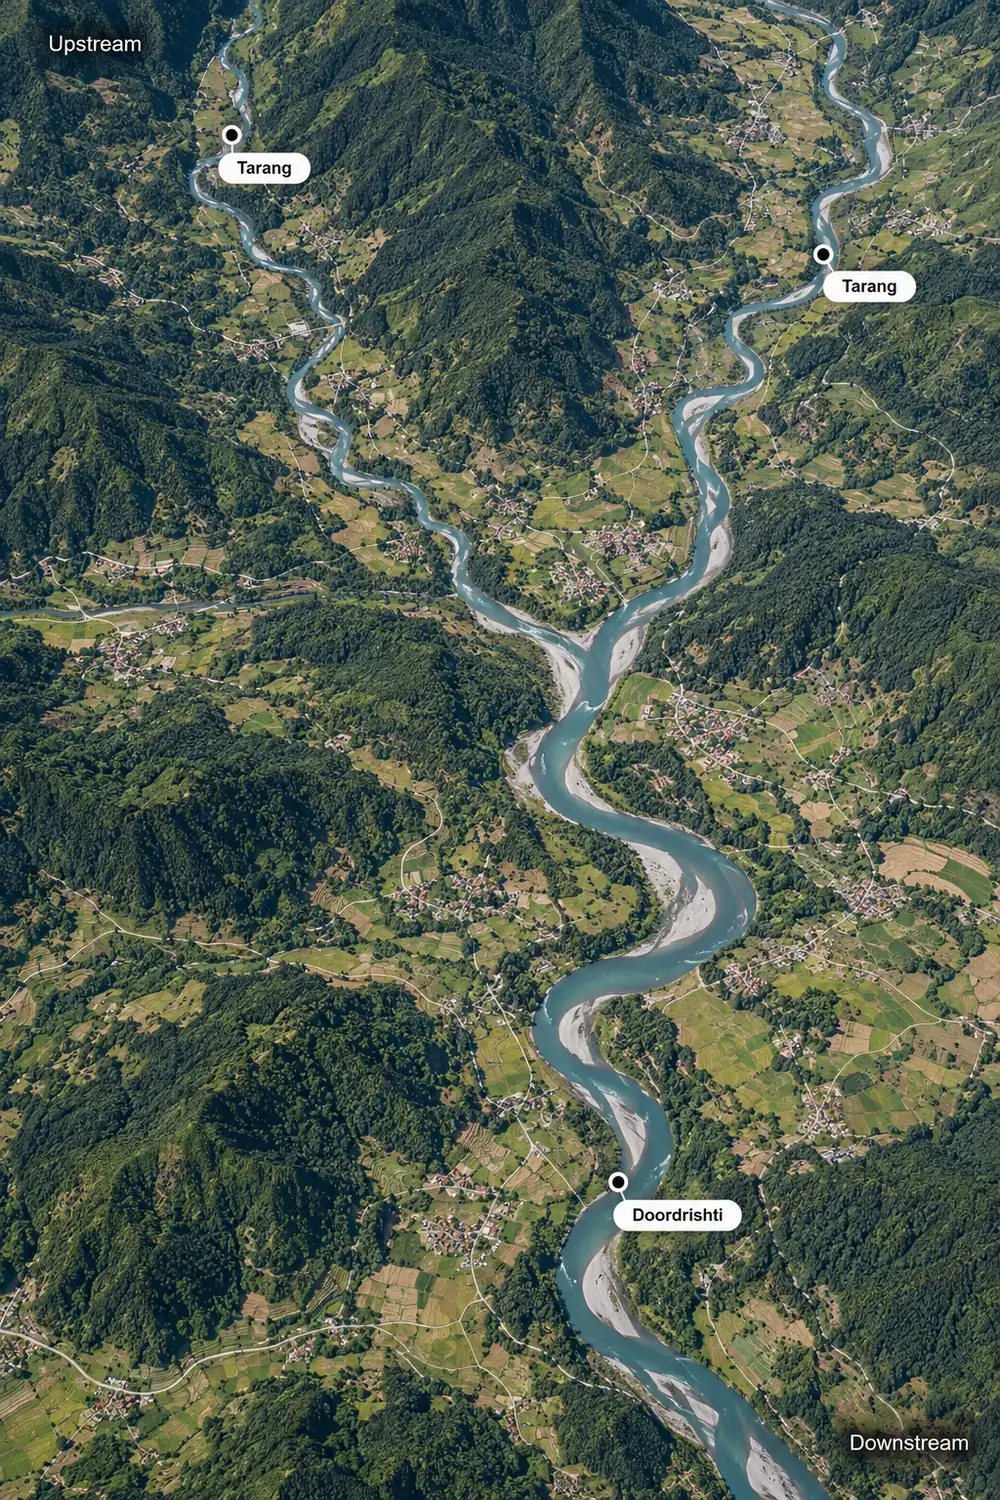
A flood warning is only useful if it reaches people before the water does, in a form they act on. That sounds obvious, but it means a warning system is really a chain of five links, and a weakness in any one of them costs time or trust. WMO and UNDRR describe the same chain as the four pillars of a multi-hazard early warning system: knowing the risk, detecting, observing and forecasting, disseminating and communicating warnings, and being prepared to respond [1]. This article walks the chain and puts numbers on each link.
- Observe what the river and the rain are doing.
- Forecast what will happen next, and when.
- Decide when a warning is warranted.
- Disseminate the warning to the people at risk.
- Respond: people act, and the system learns.
Observe: a network that sees the flood before it arrives
A single sensor at the village tells you the flood has arrived, which is too late to be a warning. The point of a network of sites is to see the flood where it starts to build, further upstream, and to track it down the river. Three kinds of measurement matter:
- Rainfall, the input. It gives the earliest sign and the longest lead time, but it measures only the point where each gauge stands. See tipping-bucket rain gauges.
- River level, the response. See how radar measures water level.
- River velocity, which says how fast a rise is travelling. See surface velocity radar.
Each device goes where it sees the most useful thing:
| Site | Device | What it adds |
|---|---|---|
| Upstream stations and tributaries | Tarang | A low-power, millimetre-accurate level reading, so the first sign of a rise is seen early |
| Mid-river bridge | Pravaah | Level and surface velocity together, to see how fast the rise is travelling |
| Key sites where verification matters | Doordrishti | Edge AI that detects events on the device and captures an image, so operators can check before they act |
| The community | Rakshak | A solar-powered siren and voice warning, triggered remotely |
Behind the sites, DeviceCloud shows every device and its readings in one place, and Aagah brings forecasts and warnings to people's phones. How the readings travel is covered in telemetry link design.
Forecast: turning an upstream rise into a downstream prediction
Observation says what is. Forecasting says what will be. The methods range from simple to elaborate, and a good system uses the simplest one that works:
- Threshold and rate of rise. No model: raise an alarm when a level or its rate of change passes a limit. Effective for small, fast catchments. See flash floods and river floods.
- Gauge-to-gauge relations. Build an empirical relation between an upstream stage and a downstream stage, with a lag. It captures the travel time of that reach from experience.
- Hydrological routing. Move a measured upstream hydrograph down the reach with a simplified physical model.
- Rainfall-runoff and hydraulic models. Use rainfall observations and forecasts to predict the flow, and a hydraulic model to predict the level.
A worked routing example: the Muskingum method
The Muskingum method is a classic routing model that treats a river reach as a storage whose volume depends on both inflow and outflow. It has two parameters: K, roughly the travel time of the flood wave through the reach, and X, a weighting between 0 and 0.5 that sets how much the wave flattens. The outflow at each time step is a weighted sum of the new inflow, the previous inflow and the previous outflow:
O(t) = C0 · I(t) + C1 · I(t−1) + C2 · O(t−1)

C0 = (−K·X + 0.5·Δt) / (K − K·X + 0.5·Δt)
C1 = ( K·X + 0.5·Δt) / (K − K·X + 0.5·Δt)
C2 = ( K − K·X − 0.5·Δt) / (K − K·X + 0.5·Δt)          C0 + C1 + C2 = 1
The coefficients sum to one, so they are weights [2]. For stability the parameters should satisfy X < Δt / (2K) < 1 − X [2]. Take a reach with K = 3 h, X = 0.1 and a time step of Δt = 1 h. The coefficients are C0 = 0.0625, C1 = 0.25 and C2 = 0.6875. Route a flood with a peak of 100 m³/s on a base flow of 10 m³/s:
| Hour | Inflow (m³/s) | Outflow (m³/s) |
|---|---|---|
| 0 | 10 | 10.0 |
| 2 | 20 | 10.6 |
| 4 | 70 | 24.6 |
| 5 | 100 | 40.6 |
| 6 | 80 | 57.9 |
| 7 | 60 | 63.6 |
| 8 | 40 | 61.2 |
| 10 | 15 | 44.1 |
| 12 | 10 | 27.0 |
| 14 | 10 | 18.0 |
Two things happen. The peak arrives two hours later (the lag), and it is lower and broader: 64 m³/s in place of 100 (the attenuation). A forecast is therefore more than a delay. For the people downstream, the useful prediction is both when the water arrives and how high it gets, and the upstream gauge supplies the input for both. Real forecasting systems add what the method leaves out: local inflow from tributaries between the gauges, a channel that is not uniform, and the updating of parameters from observed events.
What forecasts cannot do
Forecast uncertainty grows with lead time. Rainfall forecasts miss the location and intensity of convective storms, rating curves are uncertain at high flow (see rating curves), and a model calibrated on past floods may not describe a river whose bed has changed. A responsible system states the uncertainty, and relies on observation to confirm or correct the forecast as the event develops. For small, fast hill catchments, a forecast can arrive too late to be useful and observation-based triggers do most of the work.
Decide: a rule that you can measure
Between a forecast and a siren sits a decision rule: if this, then warn. A good rule is explicit, tested and tuned from events. Its quality can be measured. Count, over a season, how many floods were warned (hits H), how many were missed (M) and how many warnings were not followed by a flood (false alarms F). Three standard scores follow:
Probability of detection   POD = H / (H + M)
False alarm ratio          FAR = F / (H + F)
Critical success index     CSI = H / (H + M + F)
With 40 hits, 10 misses and 15 false alarms, POD = 0.80, FAR = 0.27 and CSI = 0.62. Raising the threshold cuts false alarms and misses more events; lowering it does the opposite. Where on that trade-off you sit is a decision about people's tolerance for each error, and a community that hears too many false alarms stops responding. Common ways to improve both scores are a two-stage system (an advisory, then a warning), requiring two independent signals, and verification at critical sites, such as a camera confirming what the radar reads.
Where lead time goes
Lead time is what is left after every step has taken its share:
T_lead = T_travel − (T_sample + T_comms + T_decision + T_dissemination)The chart below shows travel time from an upstream gauge, calculated as distance divided by flood-wave speed (the kinematic wave speed, five thirds of the mean velocity).
This is why the warning time we describe is a range, from 30 minutes to 48 hours, depending on upstream conditions. A flash flood in a steep catchment leaves little time. A wide river with a distant source can give much more, if there is a sensor far enough upstream to see it coming. The budget method, with worked comparisons of river and flash floods, is in flash floods and river floods.
Disseminate: the last mile
The warning has to reach people who may have no signal, no smartphone, or no time to check one. Sirens reach everyone within earshot. SMS and the national alerting platform reach individuals. Apps carry detail. No channel reaches everyone, so systems use several: see early warning dissemination. The acoustic planning for sirens, including terrain and background noise, is in how far can a siren be heard.
Rakshak is built for this: a solar-powered siren with a red beacon and configurable voice messages, activated remotely over GSM (2G / 3G / 4G), LoRa or VSAT, with a target trigger-to-activation time of up to 5 seconds, subject to communication conditions. We explain the communication choices in Reaching the last mile.
Respond: the link that is easiest to forget
A warning that people do not know how to act on is wasted. Response needs written procedures (who triggers what, who confirms, who moves whom), known evacuation routes and shelters, and drills that test the whole chain from sensor to siren to people. The Kerala floods of August 2018 show what happens when links are missing. A review by the court-appointed amicus curiae pointed to high storage in dams in early August, sudden discharges between 15 and 17 August, and the absence of a proper flood-forecasting system as aggravating factors [3]. Audit reporting after the event also noted that no dam in Kerala had an emergency action plan, which the National Disaster Management Authority had asked for by 2009 [4]. In the aftermath, sirens were fitted at several dams in Idukki district to warn people downstream before shutters are opened, audible within a radius of about 5 km [5]. The lesson is not about any one technology. It is that the observation, decision, dissemination and response links each have to exist, and be rehearsed, before the flood.
What a warning is worth
The benefit of early warning has been estimated globally. The Global Commission on Adaptation reported in 2019 that just 24 hours' warning of a coming hazard can cut the resulting damage by about 30 % [6]. WMO and UNDRR describe early warning systems as returning more than ten times their cost [1]. These are global averages across hazards and regions. They show the investment is worthwhile and do not predict the outcome for one river.
Start small, then grow
A system does not have to be built in one go. A common path is to begin with a few level sensors, add velocity at the key bridges, add a siren where the community is most at risk, and extend upstream as the picture improves. Because the devices and software are designed to work together, nothing needs to be replaced when you add to it.
You can explore how these parts combine on our flood early warning page, or tell us about your river and we will suggest where to place each device.
References
- WMO, Early Warnings for All: Executive Action Plan 2023 to 2027, four pillars of multi-hazard early warning systems and return on investment. public.wmo.int.
- Muskingum flood routing: coefficients, stability condition and worked method. Ponce, Engineering Hydrology, San Diego State University, and the RiverWare reach documentation.
- Amicus curiae flags sudden discharge from dams, lack of forecasting for Kerala floods, Down To Earth. downtoearth.org.in.
- Did poor government handling in Kerala cause 2018 floods? Yes, says CAG, Down To Earth. downtoearth.org.in.
- Lesson from Kerala floods: Idukki dams get sirens to alert residents on shutter opening, The News Minute. thenewsminute.com.
- Global Commission on Adaptation, Adapt Now: A Global Call for Leadership on Climate Resilience (2019), as reported in Grist.
The routing example is a worked illustration with stated parameters, computed from the Muskingum relations. The scores, lead-time chart and figures are computed or quoted as stated, and show the scale of each effect; they are not a forecast for any river.